
Spot diagram
python
from IPython.display import clear_output
clear_output()
python
import torch
import torch.nn as nn
import torch.optim as optim
import torchlensmaker as tlm
import numpy as np
Let's define a simple optical model that we'll use to demonstrate various ways of producing spot diagrams.
python
surface = tlm.Sphere(diameter=15, R=tlm.parameter(32.6656))
lens = tlm.BiLens(surface, material="BK7", outer_thickness=1.5)

optics = tlm.Sequential(
    tlm.ObjectAtInfinity(beam_diameter=10, angular_size=5.),
    tlm.Wavelength(400, 800),
    tlm.Gap(1),
    lens,
    tlm.Gap(30),
    tlm.ImagePlane(15),
)
Spot diagram with rows and cols
The row and col arguments control the sampling dimension thats use to layout the rows and columns of the diagram. row='object' and col='wavelength' is a typical choice.
python
clear_output()
tlm.show2d(optics, sampling={"base": tlm.sampling.dense(10), "object": tlm.sampling.dense(3), "wavelength": 3}, end=10)
tlm.show3d(optics, sampling={"base": 100, "object": [[np.deg2rad(0), 0.], [np.deg2rad(5), 0.]], "wavelength": 3}, end=100)
python
sampling = {"object": [[np.deg2rad(0), 0.], [np.deg2rad(5), 0.]], "wavelength": 3}
f, _ = tlm.spot_diagram(optics, sampling | {"base":1000}, row="object", col="wavelength", figsize=(12, 12))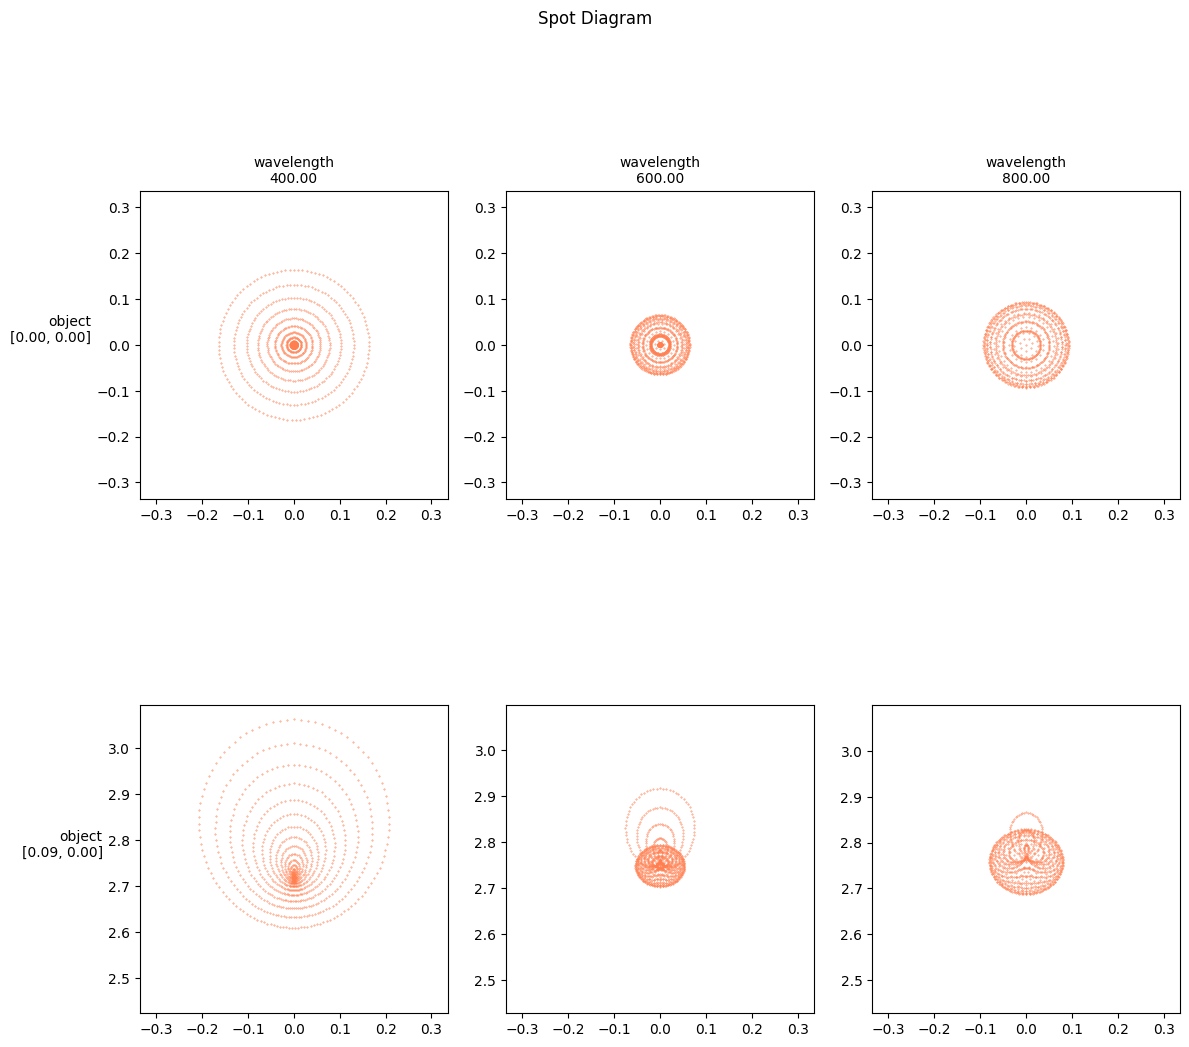
Spot diagram with color_dim
If either row or col is None, then there will be only one row or column containing every ray sample. Still, the color_dim argument can be used to color points by one dimension.
python
sampling = {"object": [[np.deg2rad(0), 0.], [np.deg2rad(5), 0.]], "wavelength": 3}
f, _ = tlm.spot_diagram(optics, sampling | {"base":1000}, row="object", col=None, color_dim="wavelength", figsize=(12, 12))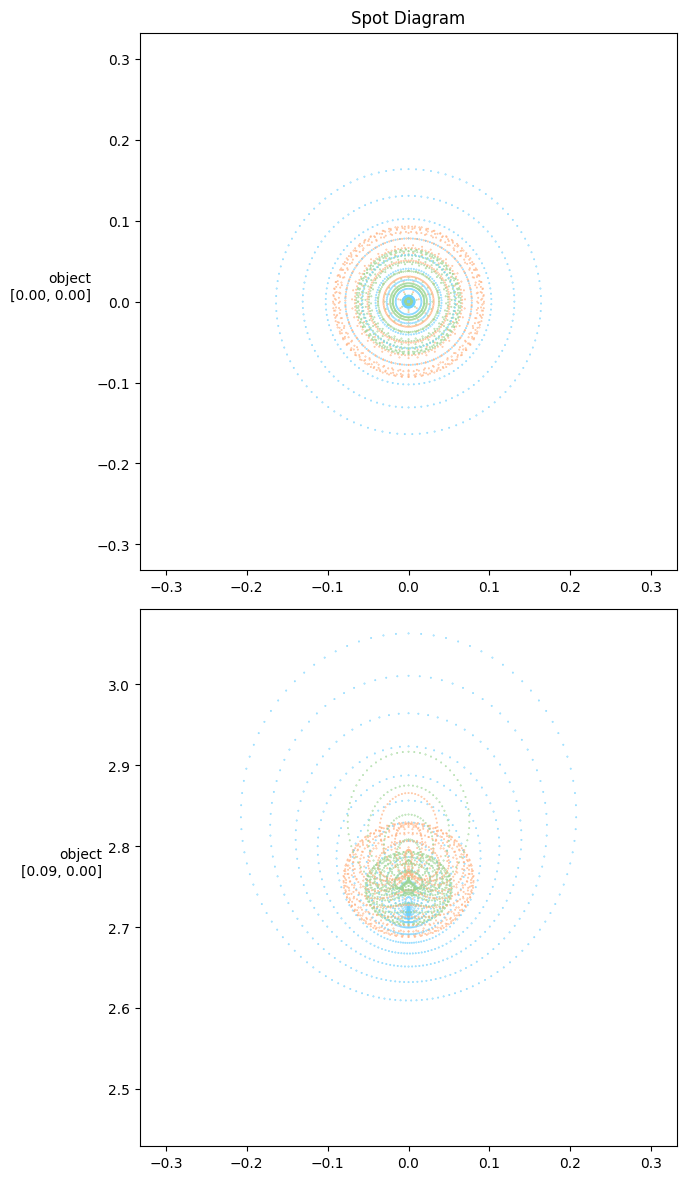
python
# TODO object coordinates are given as radian here
# but as degrees in light source init / tlm.Rotate

# if you give exact values in a sampling dict
# it becomes dimension specific